
piezobrush® PZ3: potential for virus inactivation
Authors: Dariusz Korzec, Simona Lerach and Stefan Nettesheim
Abstract
The piezobrush® PZ3, powered by the CeraPlasTM F-type piezoelectric transformer (PT), is used to generate an atmosphere with a high concentration of chemically active species and ions. In this document, we evaluate the potential of piezobrush® PZ3 and piezoelectric direct discharge (PDD) for virus inactivation.
1 Introduction
Severe acute respiratory syndrome (SARS) viruses are known to be transmitted by inhalable respiratory droplets in aerosols.2–4 They can also be deposited on surfaces, where, depending on the material, they can survive even for several days.5,6 These facts need to be considered when developing an efficient method for their inactivation. The method prescribed by the US Centers for Disease Control and Prevention (CDC) for disinfecting surfaces is to use different chemical disinfectants.7 The chemical disinfectants achieve a 5-log reduction of bacterial contaminants in five minutes.8 Sodium hypochlorite, ethyl alcohol,9 isopropanol and benzalkonium chloride10 are effective against Corona virus. Povidone-iodine has been shown to be active against human coronaviruses 229E and OC43.11 It has been observed that the SARS coronavirus is inactivated completely by 70% ethanol and povidone-iodine with an exposure time of one minute, and by 2.5% glutaraldehyde with an exposure time of five minutes.12 The other method of disinfection is using UV radiation.13 Its maximum bactericidal effect occurs at the wavelength range of 240–280 nm. Microorganism inactivation is the result of the destruction of nucleic acid through the induction of thymine dimers. The application of UV radiation in the healthcare environment (i.e., operating rooms, isolation rooms, and biological safety cabinets) is limited to the destruction of airborne organisms or inactivation of microorganisms on surfaces.
Unlike disinfection, sterilization destroys all microorganisms on the surface of an article or in a fluid to prevent disease transmission associated with the use of that item.7 The probability of microorganism survival is described using the sterility assurance level (SAL), which should be less than 10−6 for sterilization. For high-level disinfection and sterilization of semi-critical and critical medical devices, respectively – critical medical devices being those with contact to sterile body tissues or fluids – the sterilization procedures do not need to be altered for patients with known or suspected SARS. The most common sterilization methods mean that SAL < 10−6 can be achieved, including high temperature methods such as steam sterilization or flash sterilization, and low temperature methods, including ethylene oxide (EtO), peracetic acid, steam-formaldehyde, and ozone sterilization (SAL < 10−6 reported in14). The only plasma-based sterilization method prescribed by CDC uses hydrogen peroxide gas plasma, which requires the vacuum system and a process time of about one hour. Nevertheless, gas plasma sterilization is a promising method which is potentially effective against all microorganisms including prions.15,16 This statement also holds for cold atmospheric pressure plasmas.17 Sterilization effect of atmospheric pressure non-thermal air plasma are reported on dental instruments, for example.18
Recently, a number of reports have documented a significant reduction in and deactivation of different types of virus through the use of cold atmospheric plasma (CAP). The term CAP is used here for two types of atmospheric pressure plasma (APP): the dielectric barrier discharge (DBD) and the atmospheric pressure plasma jet (APPJ).19 N2 gas plasma (under pressure of 0.5 atm, 1.5 kpps = kilo-pulses per s) is not only virucidal for the influenza virus itself but also influences its viral components.20 For F viruses and adenoviruses, plasma of this kind is inducing changes in viral surface morphology, protein, and genomic RNA.21
The airborne and waterborne MS2 bacteriophages were exposed to atmospheric pressure cold plasma produced by DBD working in the 20–28 W power range. The airborne viruses were applied from MS2 viral suspension using a Collison nebulizer. A comparison of the survival rate of airborne MS2 for different gas mixtures – 2% O2 in Ar, 2% O2 in He and room air – shows that the air plasma assures the lowest survival rates, being lower than the rate for argon gas mixture by a factor of four at moderate power levels and a treatment time of 0.12 s. The survival percentage decreases rapidly with increasing plasma power. The waterborne MS2 requires a much longer treatment time in the range of few minutes to achieve a comparable reduction of viral survival.22 Terrier et al.23 have recorded a reduction of 6.5, 3.8 and 4log(10) TCID50/mL in the titrate of the hPIV-3, RSV, and influenza virus A (H5N2) suspensions, respectively, after treatment using cold oxygen plasma. Active oxygen seems to be a crucial species for the inactivation of viruses.
Bactericidal activity was proven for piezoelectric direct discharge (PDD).24 However, PDD has properties which make it very promising for virus inactivation. It operates with air, resulting in a broad spectrum of reactive oxygen species (ROS) and reactive nitrogen species (RNS) generated by such plasma. It generates large amounts of ozone (see section 2.2), which itself is used for virus decontamination. Furthermore, the negative ions produced in piezobrushR PZ3 can also be applied for virus inactivation (see section 5). Using specialized nozzles, different discharge architectures can be realized in a single plasma tool. In this document, we discuss the virucidal aspects of the piezobrushR PZ3 and other CeraPlasTM based devices.
2 Importance of ozone
The gaseous discharge in atmospheric air produces a large number of chemically active and excited species.25 They play a crucial role in all chemical reactions between plasma and the micro-organisms, so it is advantageous to maximize their concentrations. Most of them do not live long, which makes quantitative analysis quite difficult. One comparatively stable product of cold air plasma is ozone, which itself has primary importance due to its inactivation of microorganisms. In the next sections, we will take a closer look at the importance and generation of ozone.
2.1 Disinfection by ozone
Ozone can be applied for disinfection purposes either in gas or as ozonated water.26 To achieve results comparable with those for chemical disinfectants, much longer treatment times are needed using ozone at moderate concentrations in air. For the strain of Escherichia coli, death rates in excess of 99.99% were achieved after 480 minutes of exposure to ozone at a concentration of 20 ppm.27 However, the advantage of ozone is that it is generated “on the spot”, removing the need to store, transport, or handle hazardous substances.26
More rapid decontamination is possible at higher ozone concentrations. Ozone levels of 300 ppm and higher were found to be effective for disinfecting surfaces contaminated with E. coli and Staphylococcus aureus within seconds.28
Among 12 representative viruses, mostly human pathogens, the surrogate for SARS virus, murine coronavirus (MCV), is susceptible to ozone gas (peak ozone gas concentration: 20– 25 ppm) plus high (> 90%) relative humidity, resulting in > 3LOG10 inactivation.29
Both plasma- and ozone-induced depolarization of the mitochondrial membrane is observed, which is sufficient to trigger apoptosis or necrosis.30
2.2 Characterization of ozone production
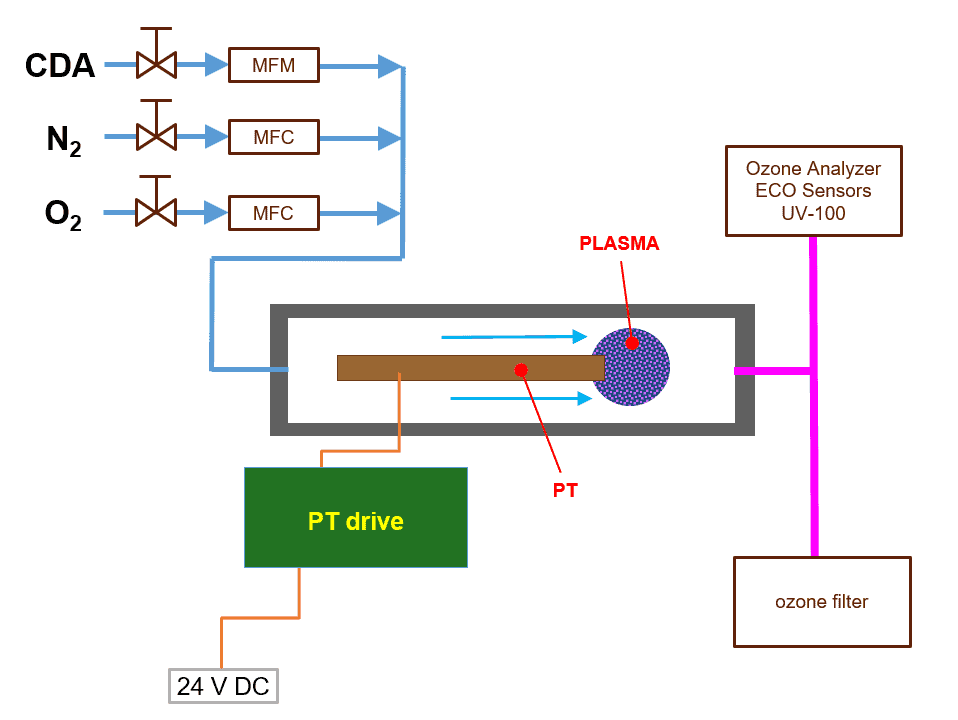
In the piezobrush® PZ3 the air flow is produced using a fan, which makes it difficult to determine the air flow exactly. To obtain exact values, the measurements of ozone concentration have been conducted for CeraPlasTM F, embedded in the experimental setup shown schematically in figure 1. The PT can be operated in CDA or in a mixture of nitrogen and oxygen. The CDA flow is controlled by a needle valve and MFM of FESTO. The nitrogen and oxygen flow are controlled by use of MFC of MKS.
The UV absorption spectroscopy is frequently used due to the high accuracy in a broad range of ozone concentration.31,32 For the ozone concentration measurements presented here, a desktop instrument based on this principle, the Ozone Analyzer Model UV-100 by ECO Sensors, Inc., is used, allowing ozone concentration measurement in the range from 0.01 to 1000 ppm (volume).
The ozone concentration can be measured directly but is not a suitable value for characterizing PT efficiency because the result strongly depends on air flow. A more suitable value for this purpose is the production rate, defined as mass of ozone produced per time unit.
Knowing the air flow fgas, the production rate of ozone Rprod can be calculated from the ozone concentration NO3 using the following equation:
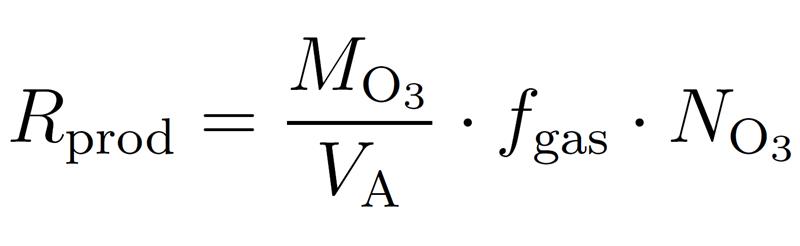
where VA is the molar volume and MO3 – the molar mass of ozone (48 g/mol).
2.2.1 Ozone concentration vs. CDA flow
The concentration of ozone as a function of CDA flow is visualized as a blue plot in figure 2. According to the fitting curve of this plot, the ozone concentration decreases almost inversely proportional to the CDA flow. The higher the flow, the stronger the dilution grade of ozone, and the lower the expected activation efficiency. To maximize the activation efficiency, the ozone concentration must be maximized by minimizing the air flow. The limiting factor regarding minimization of the air flow is the PT cooling requirements, which are dependent on the power coupled in the system.
Using the ozone concentrations from the blue plot and the equation (1), the production rates are calculated and visualized as a red plot in figure 2. For gas flow higher than 5 SLM, only a small variation in the production rate is observed. With gas flow decreasing below 5 SLM, the ozone production rate decreases. This effect can be explained by
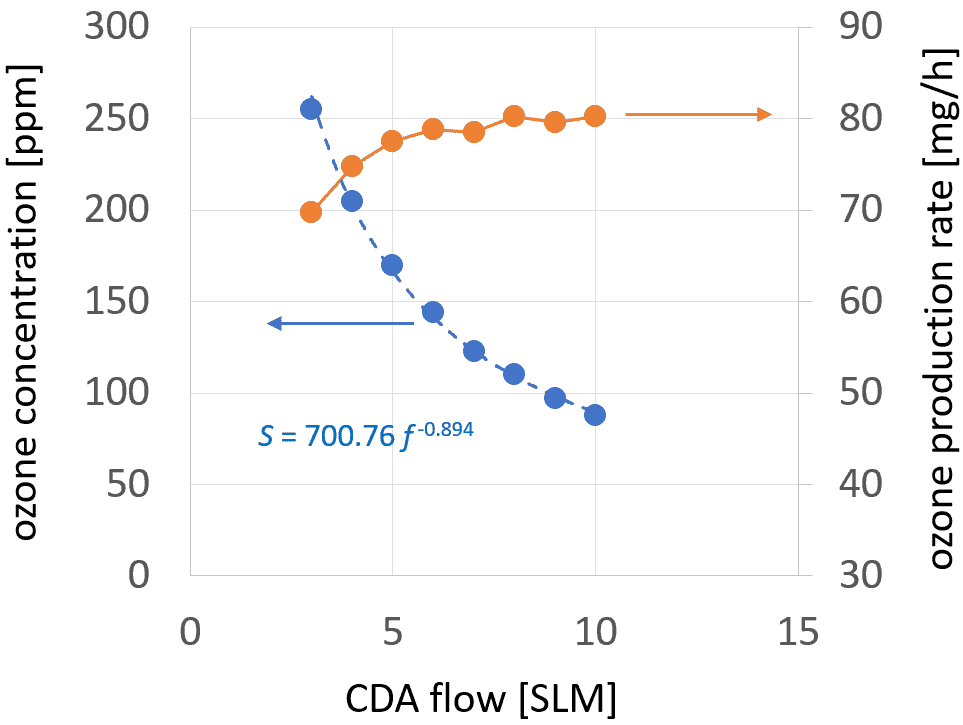
the increasing temperature of the PT due to insufficient air cooling. The increasing temperature causes a decrease in the quality of the mechanical oscillation and consequently, of the voltage step-up ratio of the PT, which is well documented in the literature.33 The flows below 3 SLM are not investigated, to avoid the risk of PT thermal damage such as unsoldering of the electric connections, local depolarization of the PZT, or a mechanical break in the PT.
2.2.2 Influence of power on ozone production rate
In figure 3, the production rate as a function of the input power of the CeraPlasTM F is displayed for a CDA flow of 8 SLM. The production rate increases in power in the entire power range investigated. It reaches the maximum value of 73 mg/h for 8 W. This trend
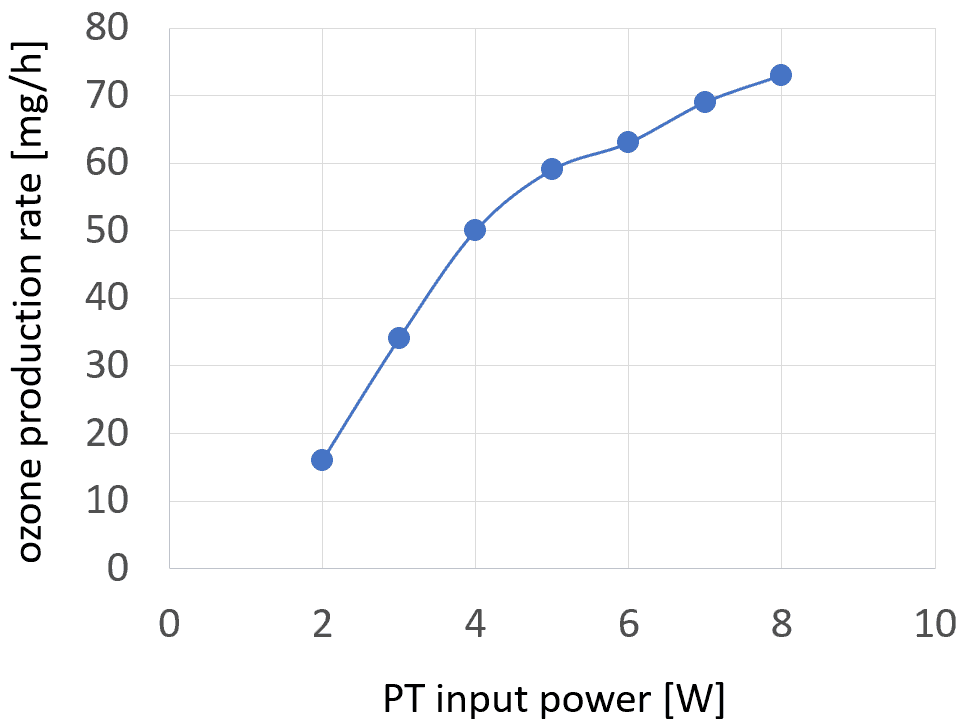
follows that of the electric field produced by the tip of the PT and of the mean value of the number of micro-discharges per cycle as a function of power. Since the micro-discharges are responsible for generating chemically active species, a correlation with not only the ozone production rate but also, the inactivation efficacy for viruses is to be expected.
The increase in the ozone production rate is faster for power values below 5 W, and slows down for higher values, which can be interpreted as a loss of ozone production efficiency (production rate per energy unit). This effect can be explained by the increasing temperature of the PT tip and resulting loss of the PT voltage gain ratio. An additional mechanism to be considered is the enhanced decomposition of the ozone with increasing temperature.34
2.2.3 Ozone concentration vs. oxygen percentage
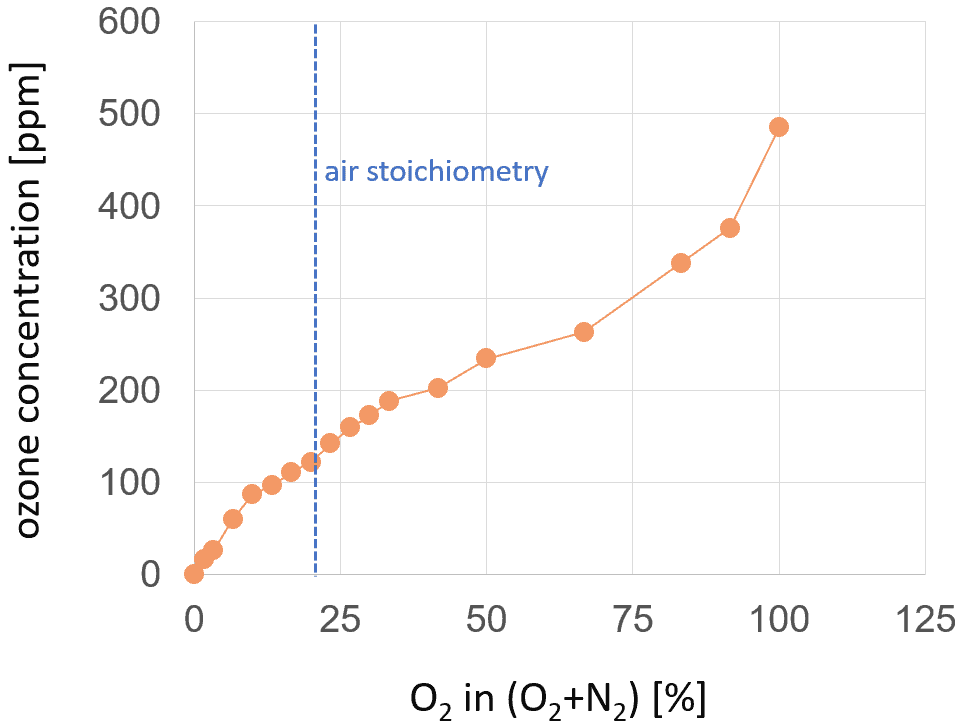
The concentration of ozone can be increased when oxygen gas mixtures with a higher oxygen percentage than that in air are used. Figure 4 demonstrates the increase in ozone concentration with the increasing percentage of oxygen in the nitrogen-oxygen gas mixture. As is to be expected, the ozone concentration for pure nitrogen is measured as equal to zero. The maximum value of 485 ppm is achieved for pure oxygen. This value is higher by a factor of four than for 20% of oxygen in a nitrogen-oxygen gas mixture, which is close to the air stoichiometry.
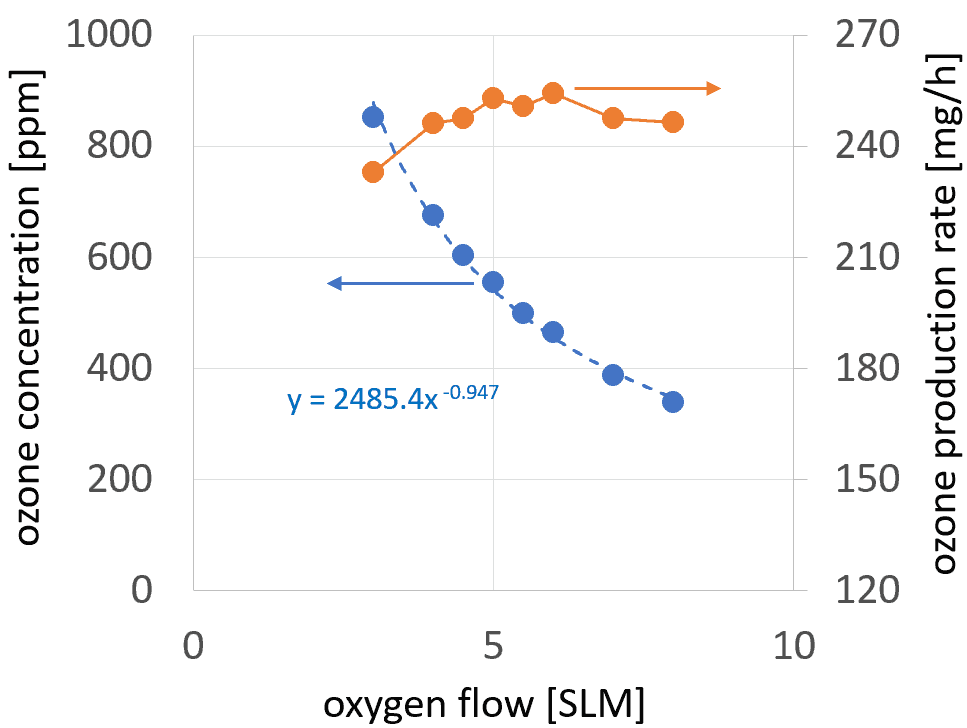
2.2.4 Ozone concentration vs. oxygen flow
The values of ozone concentration displayed are always collected 60 seconds after switching the plasma on. For shorter times, the value shown by the ozone gauge is not yet stable. For longer times the ozone values start to decrease slightly, which can be related to the increase in PT temperature. The maximum value of 852 ppm has been achieved for the oxygen flow of 3 SLM. The ozone concentration increases with decreasing oxygen flow. Furthermore, for oxygen, the PT operation was not investigated at flows below 3 SLM, so as to avoid thermal damage to the PT.
The ozone production rate changes only slightly with oxygen flow, reaching the maximum value of 254 mg/h for 6 SLM and minimum value of 233 mg/h for 3 SLM. These values are about four times higher than the production rate in CDA or ambient air.
3 Atmospheric pressure plasma jets
The atmospheric pressure plasma jets (APPJs) constitute the largest family of cold atmospheric plasma (CAP) devices used for inactivation of microorganisms. The plasma needle and the kINPen are reviewed here as examples of tools for virus inactivation.
3.1 Plasma needle
An important version of an APPJ is the plasma needle, developed for surface treatment of biological materials.35 It is a small device consisting of a needle electrode with a diameter of 0.3 mm, separated from the cylindrical grounded electrode by a dielectric barrier. It typically works with He or other noble gases. Standard operating parameters are the flow of 2 SLM and the rf (13.56 MHz) power of 0.5-2 W. It was used for the treatment of cultured cells36,37 – especially for bacterial inactivation38 – treatment of dental cavities,39,40 deactivation of Escherichia coli 41 and Streptococcus mutans bacteria.42 The treatment of mammalian cells (reattachment and apoptosis achieved) 43,44 – was also conducted invivo.45,46
3.2 The kINPen
A representative example of APPJs for biomedical applications is the kINPen.47 Similarly to the plasma needle, it consists of a pin-type electrode with a diameter of 1 mm surrounded by a quartz capillary with an inn diameter of 1.6 mm and an outer grounded electrode. It is also used with noble gases, typically Argon. The voltage of the 1.1 MHz signal supplied ranges from 2 to 6 kV. The coupled power is 2–3 W. Thanks to the very low thermal load of less than 150 mW, it is very suitable for tissue studies,48 such as in risk assessments of the application of a plasma jet in dermatology.49 It was tested for blood coagulation,50 for wound healing,51 and for destruction of malignant melanoma,52 colon cancer cells,53 and pancreatic cancer cells in vitro and in vivo.54 It shows antimicrobial properties.55 However, kINPen is designed for the very low power level needed for the treatment of living tissue, not for the effective inactivation of viruses.
3.3 Multi-gas nozzle as an APPJ
The function of the plasma needle, the kINPen, and other types of APPJs can be fulfilled by the piezobrushR PZ3 device operated with the multi-gas nozzle. It can be operated in the power range and with gas mixtures typical of the plasma needle and kINPen.
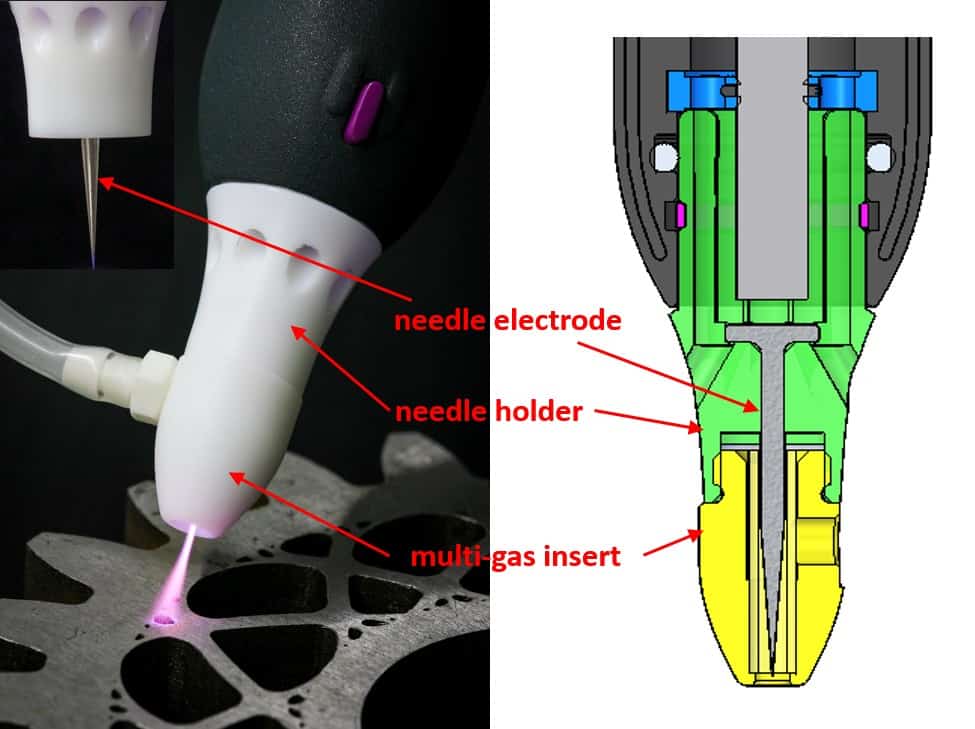
The structure of the multi-gas nozzle used with piezobrush® PZ2 is explained in figure 6. A similar solution will be implemented for the piezobrush® PZ3. The basic operation principle of the multi-gas nozzle is the ignition of plasma on the tip of a needle electrode. The electromagnetic power needed for plasma generation is coupled to the needle electrode from the PT via a narrow air gap. To avoid thermal damage, the PT must be cooled by gas flow, which is why the regular air flow is sustained in the piezobrushR PZ2 using the holes in the needle holder (see figure 6). The piezobrushR PZ2 air flow is separated from the plasma chamber into which the process gas is flowing. Consequently, the plasma on the needle electrode tip is ignited in the gas supplied through the silicon rubber gas pipe. The type and shape of the plasma mainly depend on the shape of the needle electrode tip and the electrical properties of the objects in its vicinity.
3.4 Production of plasma-activated water
The investigation of aqueous-phase chemistry and bactericidal effects from air discharge plasma in contact with water shows evidence of the formation of peroxynitrite through a pseudo-second-order post-discharge reaction of H2O2 and HNO2.56 The plasma-activated water (PAW) shows virucidal properties, as shown by using SDBD discharge (Ar with 1% air) on the example of bacteriophages T4, Φ174, and MS2.57
The piezobrushR PZ2 with needle nozzle was also applied to generate PAW. Glemser used it for mutation of microorganisms in water solutions.58 1 mL of culture was placed in a Petri dish and the multi-gas nozzle of the piezobrushR PZ2 was moved evenly over the spread-out cell solution for the assigned duration at a distance of a few millimeters.
4 Dielectric barrier discharge
Two types of dielectric barrier discharge (DBD) are the focus of research interest for medical purposes: the floating electrode DBD (FE-DBD)59 and the surface micro-discharges (SMD).60 These are subject of the following sections.
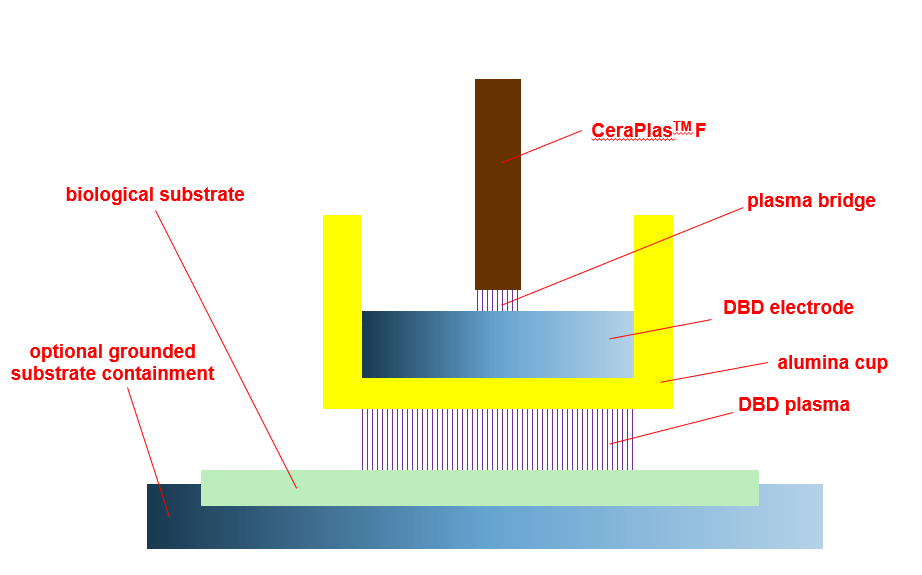
4.1 Floating electrode dielectric barrier discharge
The characteristic property of the FE-DBD is that the second electrode of the DBD discharge is the treated object (e.g., biological substrate, tissue, body of a living being).59 The structure of the FE-DBD is shown in figure 7. The applications are focused on physical and biological mechanisms of direct plasma interaction with living tissue.61 The toxicity of the cold plasma treatment for the wound on live pig skin tissue is one example.62 Applications in dentistry and oncology are alo known.63 Living tissue sterilization64 including open wounds (live rat model)65 and sterilization of Escherichia coli 66 are claimed to have been successful.
The operation principle of the near-field nozzle (NFN), which is used with piezobrush® PZ3 for the treatment of electrically conducting substrates, is identical to that of the FE-DBD. When operating with reduced power, it is suitable for live tissue treatment.
4.2 Surface micro-discharge
The surface micro-discharge (SMD) is one of surface dielectric barrier discharges (SDBDs).67,68 The structure of the SMD is shown in figure 8. At a low power level it can be used for the treatment of biomolecular films.69 SMD was applied in plasma treatment of onychomycosis,70 in cancer research,71–74 in in vivo skin treatment,75 and in the preventive medicine for nosocomial infections.76,77 The links between antimicrobial effects and plasma chemistry were studied,78 and the efficacy of plasma in regard to spores79 and bacterial decontamination (Escherichia coli) investigated.80 The realization of a specialized SMD-nozzle for piezobrush® PZ3 is being considered.
5 Negative atmospheric ions
A number of researchers are emphasizing the high importance of negative air ions (NAI) in regard to the inactivation of bacteria. Negative ions generators reduce airborne transmission of viruses.81 Negative ions can originate from different types of corona discharge.65,82
– Hagbom et al.83 used an ionizer operating at 200,000 eV and the very low current of 80 µA, generating NAI attaching to the airborne particles or aerosol droplets. The latter, negatively charged, are electrostatically attracted to a positively charged collector plate. By using such an instrument they achieved the effective prevention of the airborne transmission of the influenza A virus infection (strain Panama 99) between animals, and the inactivation of virus (>97%) using NAI.
The piezobrush® PZ3 operated with the standard nozzle generates the piezoelectric direct discharge (PDD)84 and produces chemically active species and ions of both polarities. However, the selective production of negative ions with concentrations exceeding 107cm−3 is demonstrated with special nozzle module. The generation of negative ions is measured using the CeraPlasTM HF, but it works for CeraPlasTM F as well.
5.1 Setup for NAI measurement
Figure 9 shows the setup for the generation and measurement of negative ions. Here, the standard package CeraPlasTM HF PT was applied, powered by the CeraPlasTM drive. The AlphaLab Inc. air ion counter was used to measure negative and positive ion concentrations. The distance between the tip of the CeraPlasTM HF element and the wind shield of
the ion counter in the configuration as shown in the picture was 15 cm. The CeraPlasTM package was positioned in a PMMA tube with an inner diameter of 100 mm. Air flow in the PMMA tube was established using the ebmpapst 4414M fan, whose air flow rate is typically 100 m3/h = 1670 NLM. To remove the positive ions from the air flow, an electrostatic filter shaped like an aluminum cylinder is applied, with a diameter of 32 mm and length of 40 mm. The cylinder is grounded over two serially connected diodes with 900 V reverse voltage, oriented with cathodes to the ground (see figure 9).
5.2 NAI concentration
First, the experiments without the needle electrode were conducted. The negative ion concentration of 8.4 × 106 cm−3 was achieved with PT input power of 4 W. At the same
time, the concentration of positive ions is more than 200 times lower. With decreasing PT input power, both negative ion concentration and negative ion selectivity decrease. With PT input power of 2 W, the negative ion concentration is 3.8 × 106 cm−3. The positive ion concentration is lower by a factor of 20.
In the configuration discussed above, it was not possible to reduce the ozone concentration sufficiently without reducing the negative ion concentration. To overcome this obstacle, a special nozzle construction was developed with a needle electrode permanently attached to the CeraPlasTM tip using an electrically conducting silicon rubber glue, as demonstrated in figure 9. The results obtained using this special nozzle are summarized in figure 10.
Furthermore, this setup makes it possible to achieve a negative ion concentration that is higher than 107 cm−3 and two orders of magnitude higher than the positive ion concentration. However, the main advantage of the needle solution is the very moderate ozone concentration, below 0.2 ppm. With PT input power reduced to 1 W, the ozone concentration is less than 0.02 ppm, but the high concentration of negative ions of 1.3×107 cm−3 is still reached. Although poor selectivity is the price to pay for this, a good compromise can be found between 2 and 3 W of PT input power.
6 Modular disinfecting units
Typically, the sources of atmospheric pressure plasma produce plasma in small sizes, from millimeters to a few centimeters. To up-scale the size of the treated substrate, different discharge architectures are applied based on the multiplication of a single plasma source.
One example of such a methodology is the matrix of micro-hollow cathode discharges (MHCD). Their use for inactivation of microorganisms was demonstrated using the example of yeast spores. They required 90 seconds for the inactivation of a surface of 1 cm2 that was contaminated with spores.85,86 The arrays of APPJs are described in a number of papers.87–89 In this section, the examples of modular plasma tools applying the CeraPlasTM modules are described.
6.1 For threads and fibers
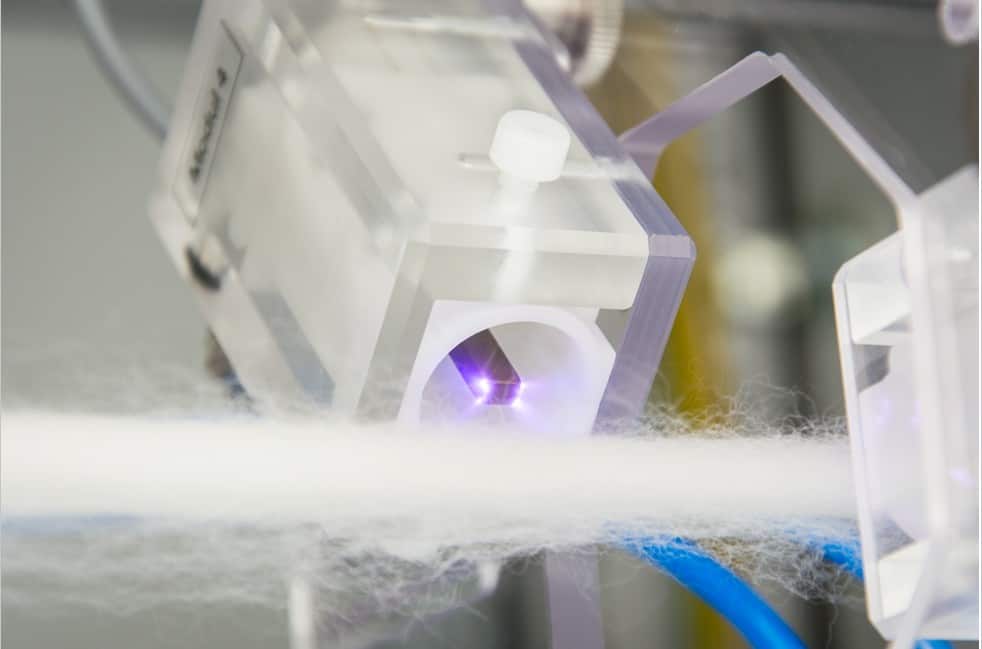
The treatment of continuous threads and ribbons of different sizes can be performed in a plasma system consisting of a number of CeraPlasTM modules distributed along the plasma source axis. Treatment speeds from a few centimeters to few tens of centimeters per second can be reached, depending on the type of substrate, number of CeraPlasTM units, and expected disinfection result. Figure 11 shows the implementation of the axial substrate movement concept for 8 CeraPlasTM HF modules. The CeraPlasTM HF modules are distributed in axial steps of 40 mm and an angular position varying by 135◦ from position to position. The modules are fixed on four carrier plates oriented perpendicularly to the direction of the substrate motion. The radial position of the CeraPlasTM module can be varied and fixed to adapt to different sizes/shapes of the substrate. The picture of a single CeraPlasTM HF module operated in front of a thread is shown in figure 12. Currently the CeraPlasTM F modules are used in modular systems, allowing treatment widths of more than 25 mm.
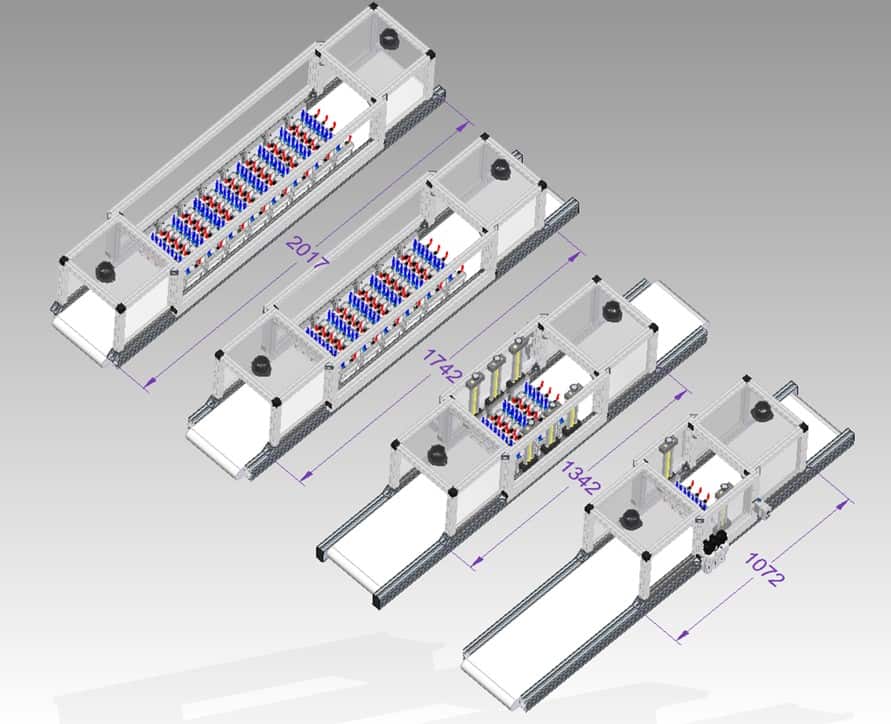
Table 1: Parameter estimations for different numbers of CeraPlasTM F devices.
| number of CeraPlasTM F | 1 | 10 | 30 | 60 | 80 |
| modules weight [kg] | 0.12 | 1.2 | 3.6 | 7.2 | 9.6 |
| Ltreat [cm] | — | 30 | 60 | 90 | 120 |
| input PT power [W] | 8.0 | 80 | 240 | 480 | 640 |
| power consumed [W] | 12 | 120 | 360 | 720 | 960 |
| gas flow [SLM] | 7 | 70 | 210 | 420 | 560 |
| O3-production rate [g/h] | 0.08 | 0.8 | 2.4 | 4.8 | 6.4 |
6.2 For the belt conveyor
Despite its versatility and efficiency, the power of the handheld piezobrush® PZ3 is limited. The only means of power scaling when using the most powerful PT in the world, the CeraPlasTM F, is to use a larger number of them. The great advantage of the modularity is the simplicity of scaling. The typical values can be assumed for each CeraPlasTM F-based module, and the specifications for any number of modules can be estimated.
Figure 13 shows four variants of the plasma system for treatment of goods on a belt conveyor with 10, 30, 60 and 80 CeraPlasTM F plasma modules, respectively. The plasma modules are organized in rows, ten modules in each row. The operating parameters of these systems are summarized in table 1. The architecture of each system is similar. The CeraPlasTM drives are supplied with 24 V DC from a common power supply. The ACDC converter of the power supply is dimensioned according to the number of PT modules used. The entire system consists of input, treatment, and output chambers. Those are separated from each other and from the outside environment with silicon rubber curtains, which minimize the outflow of ozone to the environment and keep the ozone concentration in the treatment chamber high. The most important measure for avoiding the outflow of ozone is the extraction system attached to the input and output chambers. The exhaust flow of the extraction system is adjusted to the gas intake of the PT modules. The PT modules are fed with compressed dry air (CDA) or other gases, such as oxygen, by means of the gas distribution system, with common gas manifold and mass flow controllers configured according to the number of modules and the needs of the process. The belt conveyor transfers the objects to be disinfected through the system. Thanks to the adjustable vertical position of the PT module rows, objects of very different shapes and sizes can be treated.
7 Conclusion
The handheld piezobrush® PZ3 has properties which make it a very versatile device for virus inactivation. It is especially useful for research in this field, because it allows for different plasma species. The ozone production rate for 8 W power and air is 80 mg/h, allowing ozone concentrations of >100 ppm to be achieved. Negative ions can be produced by means of a specialized nozzle, reaching concentrations of 107 ions per cubic centimeter.
The concept enables easy replacement of the nozzles, ensuring that the piezobrush® PZ3 is highly versatile and therefore easy to implement as a research tool. Different plasma types used in the field of virus inactivation: APPJ, DBD, FE-DBD, SMD, and others can be retrofitted using the specialized nozzles. The production of PAW using plasma needle and multi-gas nozzle is also demonstrated.
Based on the CeraPlasTM F piezoelectric transformer, a device was built which allows ozone concentrations of up to 1000 ppm in flow to be achieved, which would suffice to kill and decompose the most resistant viruses. By blowing the plasma gas of a CeraPlasTM Fbased device into a closed chamber or bag, conditions could be achieved which are not only sufficient for disinfection, but also for sterilization.
Thanks to its modularity, the disinfection processes developed with the piezobrush® PZ3 can be easily upscaled in size and speed.
Acknowledgments
The authors thanks Andrej Shapiro for the mockup of the modular system. We also acknowledge the contribution of Daniel Neuwirth to the measurements of the negative ion concentration.
References
- M. Lipsitch, T. Cohen, B. Cooper, J. M. Robins, S. Ma, L. James, G. Gopalakrishna, S. K. Chew, C. C. Tan, M. H. Samore, D. Fisman, and M. Murray. Transmission dynamics and control of severe acute respiratory syndrome. Science, 300(5627):1966– 1970, 2003.
- I. T. Yu, Y. Li, T. W. Wong, and et al. Evidence of airborne transmission of the severe acute respiratory syndrome virus. N. Engl. J. Med., 350(17):1731–1739, 2004.
- R. A. Fowler, D. C. Scales, and R. Ilan. Evidence of airborne transmission of sars. N Engl J Med., 351(6):609–611, 2004.
- B. Bean, B. M. Moore, B. Sterner, L. R. Peterson, D. N. Gerding, and H. H. Balfour. Survival of influenza viruses on environmental surfaces. J. Infect. Dis., 146(1):47–51, 1982.
- J. Oxford et al. The survival of influenza A(H1N1)pdm09 virus on 4 household surfaces. American Journal of Infection Control, 42:423–5, 2014.
- W. A. Rutala and D. J. Weber. Hicpac, guideline for disinfection and sterilization in healthcare facilities. http://www.cdc.gov/ncidod/dhqp/pdf/guidelines/ Disinfection_Nov_2008.pdf, 8 2008. US Patent 2,830,274.
- G. Moore, C. Griffith, and A. Peters. Bactericidal properties of ozone and its potential applications as a terminal disinfectant. Journal of Food Protection, 63(8):1100–1106, 2000.
- S. A. Sattar, V. S. Springthorpe, Y. Karim, and P. Loro. Chemical disinfection of nonporous inanimate surfaces experimentally contaminated with four human pathogenic viruses. Epidemiol. Infect., 102:493–505, 1989.
- M. Saknimit, I. Inatsuki, Y. Sugiyama, and K. Yagami. Virucidal efficacy of physicochemical treatments against coronaviruses and parvoviruses of laboratory animals. Jikken Dobutsu, 37:341–5, 1988.
- J. Sizun, M. W. Yu, and P. J. Talbot. Survival of human coronaviruses 229e and oc43 in suspension and after drying on surfaces: a possible source of hospital-acquired infections. J. Hosp. Infect., 46:55–60, 2000.
- H. Kariwa, N. Fujii, and I. Takashima. Inactivation of SARS coronavirus by means of povidone-iodine, physical conditions, and chemical reagents. Jpn. J. Vet. Res., 52:105–12, 2004.
- F. Ansaldi, F. Banfi, P. Morelli, L. Vallle, P. Durando, L. Sticchi, S. Contos, R. Gasparini, and P. Crovari. SARS-CoV, influenza A and syncitial respiratory virus resistance against common disinfectants and ultraviolet irradiation. J. of Preventive Medicine and Hygiene, 45:5–8, 2004.
- S. Dufresne, A. Hewitt, and S. Robitaille. Ozone sterilization: Another option for healthcare in the 21st century. American Journal of Infection Control, 32(3): E26–E27, 2004.
- A. Sakudo and H. Shintani. Sterilization and Disinfection by Plasma: Sterilization Mechanisms, Biological and Medical Applications (Medical Devices and Equipment). Nova Science Publishers, New York, NY, USA, 2010.
- A. Sakudo, Y. Yagyu, and T. Onodera. Disinfection and sterilization using plasma technology: Fundamentals and future perspectives for biological applications. Int. J. Mol. Sci., 20(5216):1–17, 2019.
- M. Laroussi. Low temperature plasma-based sterilization: Overview and state-of the-art. Plasma Proc. Polym., 2(5):391–400, 2005.
- S.-J. Sung et al. Sterilization effect of atmospheric pressure non-thermal air plasma on dental instruments. J. Adv. Prosthodont., (5):2–8, 2013.
- M. Weiss, G. Daeschlein, A. Kramer, M. Burchardt, S. Brucker, D. Wallwiener, and M. B. Stope. Virucide properties of cold atmospheric plasma for future clinical applications. Journal of Medical Virology, 89:952–959, 2017.
- A. Sakudo, N. Shimizu, Y. Imanishi, and K. Ikuta. N2 gas plasma inactivates influenza virus by inducing changes in viral surface morphology, protein, and genomic RNA. Biomed. Res. Int., (694269):–, 2013.
- A. Sakudo, Y. Toyokawa, and Y. Imanishi. Nitrogen gas plasma generated by a static induction thyristor as a pulsed power supply inactivates adenovirus. PLOS ONE, 11(6):1–17, 06 2016.
- Y. Wu, Liang, and K. Wei et al. Ms2 virus inactivation by atmospheric-pressure cold plasma using different gas carriers and power levels. Appl Environ Microbiol., 81(3):996–1002, 2015.
- O. Terrier, B. Essere, M. Yver, M. Barth´el´emy, M. Bouscambert-Duchamp, P. Kurtz, D. VanMechelen, F. Morfin, G. Billaud, O. Ferraris, B. Lina, M. Rosa-Calatrava, and V. Moules. Cold oxygen plasma technology efficiency against different airborne respiratory viruses. Journal of Clinical Virology, 45(2):119–124, 2009.
- S. Nettesheim, D. Burger, M. Szulc, W. Falk, and G. Riess. Effect of piezoelectric direct discharge plasma on microorganisms. https://doi.org/10.13140/2.1.2866. 3363, 2014.
- R. Dorai and M. J. Kushner. A model for plasma modification of polypropylene using atmospheric pressure discharges. J. Phys. D: Appl. Phys., 36:666–685, 2003.
- A. Pascual, I. Llorca, and A. Canut. Use of ozone in food industries for reducing the environmental impact of cleaning and disinfection activities. Trends in Food Sci. & Technol., 18:S29–S35, 2007.
- W. J. Kowalski, W. P. Bahnfleth, B. A. Striebig, and T. S. Whittam. Demonstration of a hermetic airborne ozone disinfection system: Studies on e. coli. AIHA Journal, 64:222–227, 2003.
- W.J. Kowalski, W.P. Bahnfleth, and T.S. Whittam. Bactericidal effects of high airborne ozone concentrations on Escherichia coli and Staphylococcus aureus. Ozone: Science & Engineering, 20(3):205–221, 1998.
- J. B. Hudson, M. Sharma, and S. Vimalanathan. Development of a practical method for using ozone gas as a virus decontaminating agent. The Journal of the International Ozone Association, 31(3):216–223, 2009.
- O. Lunov, V. Zablotskii, O.Churpita, E. Cha´nova´, E. Sykova´, A. Dejneka, and S. Ku-ˇ binova´. Cell death induced by ozone and various non-thermal plasmas: therapeutic perspectives and limitations. Scientific Reports, 4(7129):1–11, 2014.
- L. T. Molina and M. J. Molina. Absolute absorption cross sections of ozone in the 185- to 350-nm wavelength range. J. Geophys. Research, 91(D13):14,501–14,508, 1986.
- D. Daumont, J. Brion, J. Charbonnier, and J. Malicet. Ozone UV spectroscopy I: Absorption cross-section at room temperautre. Journal of Atmospheric Chemistry, 15:145–155, 1992.
- Y.-H. Su. Power Enhancement of Piezoelectric Technology based Power Devices by Using Heat Transfer Technology. PhD thesis, L’Ecole Normale Superieure de Cachan, 94235 Cachan Cedex, France, 2014.
- Sidney W. Benson and Arthur E. Axworthy. Mechanism of the gas phase, thermal decomposition of ozone. The Journal of Chemical Physics, 26(6):1718–1726, 1957.
- E. Stoffels, A. J. Flikweert, W. W. Stoffels, and G. M. W. Kroesen. Plasma needle: a non-destructive atmospheric plasma source for fine surface treatment of (bio)materials. Plasma Sources Sci. Technol., 11:383–388, 2002.
- I. E. Kieft, M. Kurdi, and E. Stoffels. Reattachment and apoptosis after plasmaneedle treatment of cultured cell. IEEE Transactions on Plasma Science, 34(4):1331– 1336, 2006.
- O. Volotskova, A. Shashurin, M. A. Stepp, S. Pal-Ghosh, and M. Keidar. Plasmacontrolled cell migration: Localization of cold plasma–cell interaction region. Plasma Medicine, 1(1):85–92, 2011.
- R. S. Tipa, B. Boekema, E. Middelkoop, and G. M. W. Kroesen. Cold plasma for bacterial inactivation. In International Symposium on Plasma Chemistry – ISPC, July 24–29, Philadelphia, USA, pages 1–4, 2011.
- R. E. J. Sladek, E. Stoffels, R. Walraven, P. J. A. Tielbeek, and R. A. Koolhoven. Plasma treatment of dental cavities: A feasibility study. IEEE Transactions on Plasma Science, 32(4):1540–1543, 2004.
- R. E. J. Sladek. Plasma needle : non-thermal atmospheric plasmas in dentistry. PhD thesis, Technische Universiteit Eindhoven, 2006. https://doi.org/10.6100/IR613009.
- R. E. J. Sladek and E. Stoffels. Deactivation of Escherichia coli by the plasma needle. Journal of Physics D: Applied Physics, 38(11):1716–1721, may 2005.
- J. Goree, B. Liu, D. Drake, and E. Stoffels. Killing of S. mutans bacteria using a plasma needle at atmospheric pressure. IEEE Tr. Plasma Sci., 34(4):1317–1324, 2006.
- E. Stoffels, I. E. Kieft, and R. E. J. Sladek. Superficial treatment of mammalian cells using plasma needle. Journal of Physics D-Applied Physics, 36(23):2908–2913, 2003.
- I. E. Kieft, D. Darios, A. J. M. Roks, and E. Stoffels. Plasma treatment of mammalian vascular cells: A quantitative description. IEEE Transactions on Plasma Science, 33(2):771–775, 2005.
- E. Stoffels, I. E. Kieft, R. E. J. Sladek, L. J. M. van den Bedem, E. P. van der Laan, and M. Steinbuch. Plasma needle for in vivo medical treatment: recent developments and perspectives. Plasma Sources Sci. Technol., 15:S169–S180, 2006.
- E. Stoffels, A. J. M. Roks, and L. E. Deelman. Delayed effects of cold atmospheric plasma on vascular cells. Plasma Process. Polym., 5:599–605, 2008.
- K. Landsberg, Ch. Scharf, K. Darm, K. Wende, G. Daeschlein, E. Kindel, K.-D. Weltmann, and Th. von Woedtke. Use of proteomics to investigate plasma-cell interactions. Plasma Medicine, 1(1):55–63.
- M. Weiss, J. Barz, M. Ackermann, R. Utz, A. Ghoul, C.-D. Weltmann, M. B. Stope, D. Wallwiener, K. Schenke-Layland, Ch. Oehr, S. Brucker, and P. Loskill. Dose-dependent tissue-level characterization of a medical atmospheric pressure argon plasma jet. ACS Appl. Mater. Interfaces, 11(22):19841–19853, 2019.
- J. Lademann, H. Richter, A. Alborova, D. Humme, and A. Patzelt. Risk assesment of the application of a plasma jet in dermatology. J. Biomedical Optics, 14(5):054025, 2009.
- C. Heslin, D. Boehm, V. Milosavljevic, M. Laycock, P. J. Cullen, and P. Bourkea. Quantitative assessment of blood coagulation by cold atmospheric plasma. Plasma Medicine, 4(1-4):153–163, 2014.
- S. Arndt, A. Schmidt, S. Karrer, and T. von Woedtke. Comparing two different plasma devices kinpen and adtec steriplas regarding their molecular and cellular effects on wound healing. Clinical Plasma Medicine, 9:24–33, 2018.
- G. Pasqual-Melo, R. K. Gandhirajan, I. Stoffels, and S. Bekeschusa. Targeting malignant melanoma with physical plasmas. Clinical Plasma Medicine, 10:1–8, 2018.
- S. Bekeschus, A. Lin, A. Fridman, K. Wende, K.-D. Weltmann, and V. Miller. A comparison of floating-electrode dbd and kinpenjet: Plasma parameters to achieve similar growth reduction in colon cancer cells under standardized conditions. Plasma Chem Plasma Process, 38:1–12, 2018.
- L. I. Partecke at al. Tissue tolerable plasma (TTP) induces apoptosis in pancreatic cancer cells in vitro and in vivo. BMC Cancer, 12(473):1–10, 2012.
- M. S. Mann, U. Schnabe, T. Weihe, Weltmann, and Thomas von Woedtke. A reference technique to compare the antimicrobial properties of atmospheric pressure plasma sources. Plasma Medicine, 5(1):27–47, 2015.
- P. Lukes, E. Dolezalova, I. Sisrova, and M. Clupek. Aqueous-phase chemistry and bactericidal effects from an air discharge plasma in contact with water: evidence for the formation of peroxynitrite through a pseudo-second-order post-discharge reaction of H2O2 and HNO2. Plasma Sources Science and Technology, 23(1):015019, feb 2014. [57] L. Guo, R. Xu, and L. Gou et al. Mechanism of virus inactivation by cold atmospheric-pressure plasma and plasma-activated water. Appl Environ Microbiol., 84(17):1–10, 2018.
- M. Glemser. Enhancing microalgae cultivation: Illumination effects and mutation procedures. PhD thesis, Technischen Universita¨t Mu¨nchen, 2019.
- G. Fridman, G. Friedman, A. Gutsol, A. B. Shekhter, V. N. Vasilets, and A. Fridman. Applied plasma medicine. Plasma Process. Polym., 5:503––533, 2008.
- Y. Sakiyama, D. B. Graves, H.-W. Chang, T. Shimizu, and G. E. Morfill. Plasma chemistry model of surface microdischarge in humid air and dynamics of reactive neutral species. J. Phys. D: Appl. Phys., 45(425201):1–19, 2012.
- D. Dobrynin, G. Fridman, G. Friedman, and A. Fridman. Physical and biological mechanisms of direct plasma interaction with living tissue. New Journal of Physics, 11(115020):1–26, 2009.
- D. Dobrynin, A. Wu, S. Kalghatgi, S. Park, N. Shainsky, K. Wasko, E. Dumani, R. Ownbey, S. Joshi, R. Sensenig, and A. D. Brooks. Live pig skin tissue and wound toxicity of cold plasma treatment. Plasma Medicine, 1(1):93–108, 2011.
- C. Hoffmann, C. Berganza, and J. Zhang. Cold atmospheric plasma: methods of production and application in dentistry and oncology. Medical Gas Research, 3(21):1– 15, 2013.
- G. Fridman, M. Peddinghaus, H. Ayan, A. Fridman, M. Balasubramanian, A. Gutsol, A. Brooks, and G. Friedman. Blood coagulation and living tissue sterilization by floating-electrode dielectric barrier discharge in air. Plasma Chem Plasma Process, 2006.
- D. Dobrynin, K. Wasko, G. Friedman, A. Fridman, and G. Fridman. Cold plasma sterilization of open wounds: Live rat model. Plasma Medicine, 1(2):109–114, 2011.
- N. Kunapareddy, D. Dobrynin, G. Friedman, A. Fridman, G. Fridman, and J. Grun. Evaluation of dielectric barrier discharge sterilization of escherichia coli with a sweptwavelength resonance-raman device. Plasma Medicine, 1(3-4):231–240, 2011.
- T. Shimizu, Y. Sakiyama, D. B. Graves, J. L. Zimmermann, and G. E. Morfill. The dynamics of ozone generation and mode transition in air surface micro-discharge plasma at atmospheric pressure. New Journal of Physics, 14(10):103028, 2012.
- E. A. J. Bartis, A. J. Knoll, P. Luan, J. Seog, and G. S. Oehrlein. On the interaction of cold atmospheric pressure plasma with surfaces of bio-molecules and model polymers. Plasma Chem. Plasma Process., 36:121–149, 2016.
- E. A. J. Bartis, P. Luan, A. J. Knoll, D. B. Graves, J. Seog, and G. S. Oehrlein. Correlates with surface-bound NO3 after cold atmospheric plasma treatment. Plasma Process. Polym., 13:410–418, 2016.
- Z. Xiong, J. Roe, T. C. Grammer, and D. B. Graves. Plasma treatment of onychomycosis. Plasma Processes and Polymers, 13(6):588—-597, 2016.
- M. Vandamme, E. Robert, S. Dozias, J. Sobilo, S. Lerondel, A. Le Pape, and J.-M. Pouvesle. Response of human glioma u87 xenografted on mice to non thermal plasma treatment. Plasma Medicine, 1(1):27—-43, 2011.
- J. K¨oritzer. Biophysical effects of cold atmospheric plasma on glial tumor cells. PhD thesis, Ludwig-Maximilian-Universita¨t Mu¨nchen, 2013.
- V. Boxhammer. Development of a safe therapeutic window for cold atmospheric plasma treatments. PhD thesis, Ludwig-Maximilian-Universit¨at Mu¨nchen, 2014.
- S. Arndt, E. Wacker, Y.-F. Li, T. Shimizu, H. M. Thomas, G. E. Morfill, S. Karrer, J. L. Zimmermann, and A.-K. Bosserhoff. Cold atmospheric plasma, a new strategy to induce senescence in melanoma cells. Experimental Dermatology, 22:284–289, 2013.
- Y.-F. Li, D. Taylor, J. L. Zimmermann, W. Bunk, R. Monetti, G. Isbary, V. Boxhammer, H.-U. Schmidt, T. Shimizu, H. M. Thomas, and G. E. Morfill. In vivo skin treatment using two portable plasma devices: comparison of a direct and an indirect cold atmospheric plasma treatment. Clinical Plasma Medicine, 1:35—-39, 2013.
- G. E. Morfill, T. Shimizu, B. Steffes, and H.-U. Schmidt. Nosocomial infections—a new approach towards preventive medicine using plasmas. New Journal of Physics, 11(115019):1–10, 2009.
- T. G. Kl¨ampfl. Cold atmospheric plasma decontamination against nosocomial bacteria. PhD thesis, Technische Universita¨t Mu¨nchen, 2014.
- J. Jeon. Surface micro-discharge (SMD) – analysis of the antimicrobial effect and the plasma chemistry. PhD thesis, Ludwig-Maximilian-Universit¨at Mu¨nchen, 2019.
- T. G. Kla¨mpfl, G. Isbary, T. Shimizu, Y.-F. Li, J. L. Zimmermann, W. Stolz, Ju¨rgen Schlegel, G. E. Morfill, and H.-U. Schmidt. Cold atmospheric air plasma sterilization against spores and other microorganisms of clinical interest. Applied and Environmental Microbiology, 78:5077—-5082, 2012.
- P. Luan, L. J. Bastarrachea, A. R. Gilbert, Rohan Tikekar, and G. S. Oehrlein. Decontamination of raw produce by surface microdischarge and the evaluation of its damage to cellular components. Plasma Processes and Polym., (201800193):1–11, 2019.
- B. W. Mitchell and D. J. King. Effect of negative air ionization on airborne transmission of newcastle disease virus. Avian Diseases, 38(4):725–732, 1994.
- L. A. Fletcher, L. F. Gaunt, C. B. Beggs, S. J. Shepherd, P. A. Sleigh, C. J. Noakes, and K. G. Kerr. Bactericidal action of positive and negative ions in air. BMC Microbiology, 7(32):–, 2007.
- M. Hagbom, J. Nordgren, R. Nybom, K.-O. Hedlund, H. Wigzell, and L. Svensson. Ionizing air affects influenza virus infectivity and prevents airborne-transmission. Nature: Scientific Reports, 5(11431):1–10, 2015.
- Wikipedia. Piezoelectric direct discharge plasma. https://en.wikipedia.org/ wiki/Piezoelectric_direct_discharge_plasma, 2016. [Online; accessed 17-Oct2016].
- J. F. Kolb, A.-A H. Mohamed, R. O. Price, R. J. Swanson, A. Bowman, R. L. Chiavarini, M. Stacey, and K. H. Schoenbach. Cold atmospheric pressure air plasma jet for medical applications. Appl. Phys. Letters, 92(241501):1–3, 2008.
- K. Becker, A. Koutsospyros, S.-M. Yin, C. Christodoulatos, N. Abramzon, J. C. Joaquin, and G. Brelles-Mari no. Environmental and biological applications of microplasmas. Plasma Phys. Control. Fusion, 47:B513–B523, 2005.
- F. Fanelli and F. Fracassi. Atmospheric pressure non-equilibrium plasma jet technology: general features, specificities and applications in surface processing of materials. Surface and Coatings Technology, 322:174–201, 2017.
- K.-D. Weltmann, R. Brandenburg, T. von Woedtke, J. Ehlbeck, R. Foest, M. Stieber, and E. Kindel. Antimicrobial treatment of heat sensitive products by miniaturized atmospheric pressure plasma jets (APPJs). J. Phys. D: Appl. Phys., 41(194008):1–6, 2008.
- M. Teschke, J. Kedzerski, and J. Engemann. Time and spatially resolved studies of an khz-excited atmospheric pressur jet for industial applications. In 48th Annual Technical Conference Proceedings of Society of Vacuum Coaters, volume 505/856-7188, pages 1–7, 2005.